AI video infographics from a file: what Wan 3.0 accepts
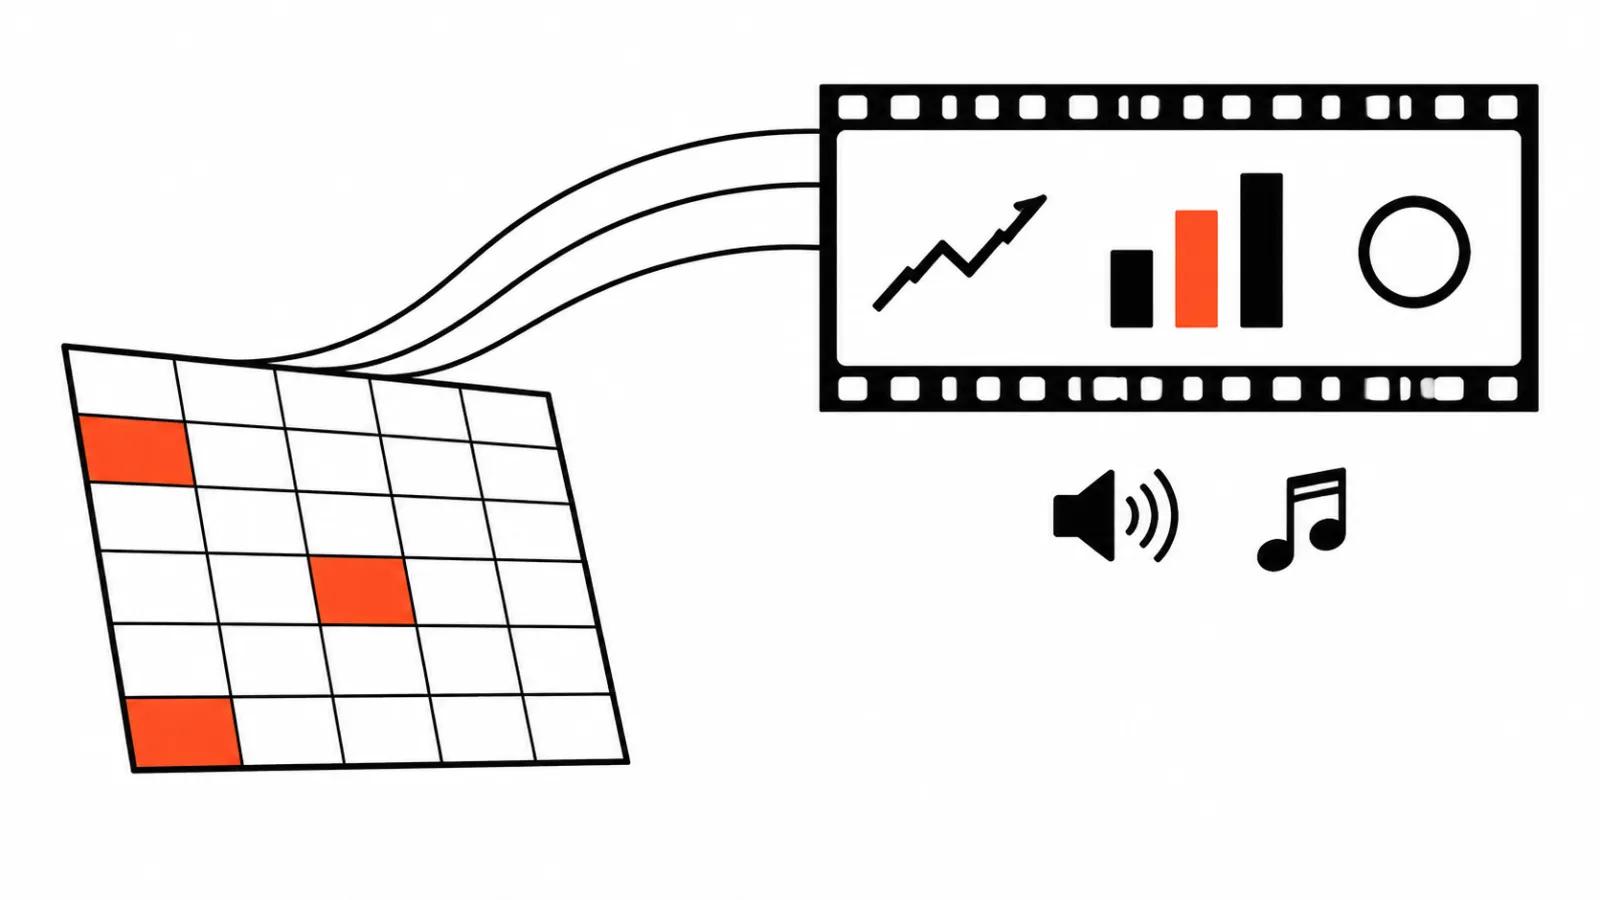
AI video infographics are clips where numbers move: a line climbs, bars arrive one after another, the total assembles into a ring. Until recently you built that in an editor, by hand: a spreadsheet, keyframes, an animated curve, a voice-over, music. Wan 3.0 changes the entry point. You hand it a file or a link and get a finished clip with sound.
The Alibaba Cloud documentation was updated on October 27, 2026 and lists the formats: docx, doc, xlsx, xls, pptx, ppt, pdf, txt, md. One source only, either a file or a public link to a page that needs no login. A file plus a link in a single request does not work.
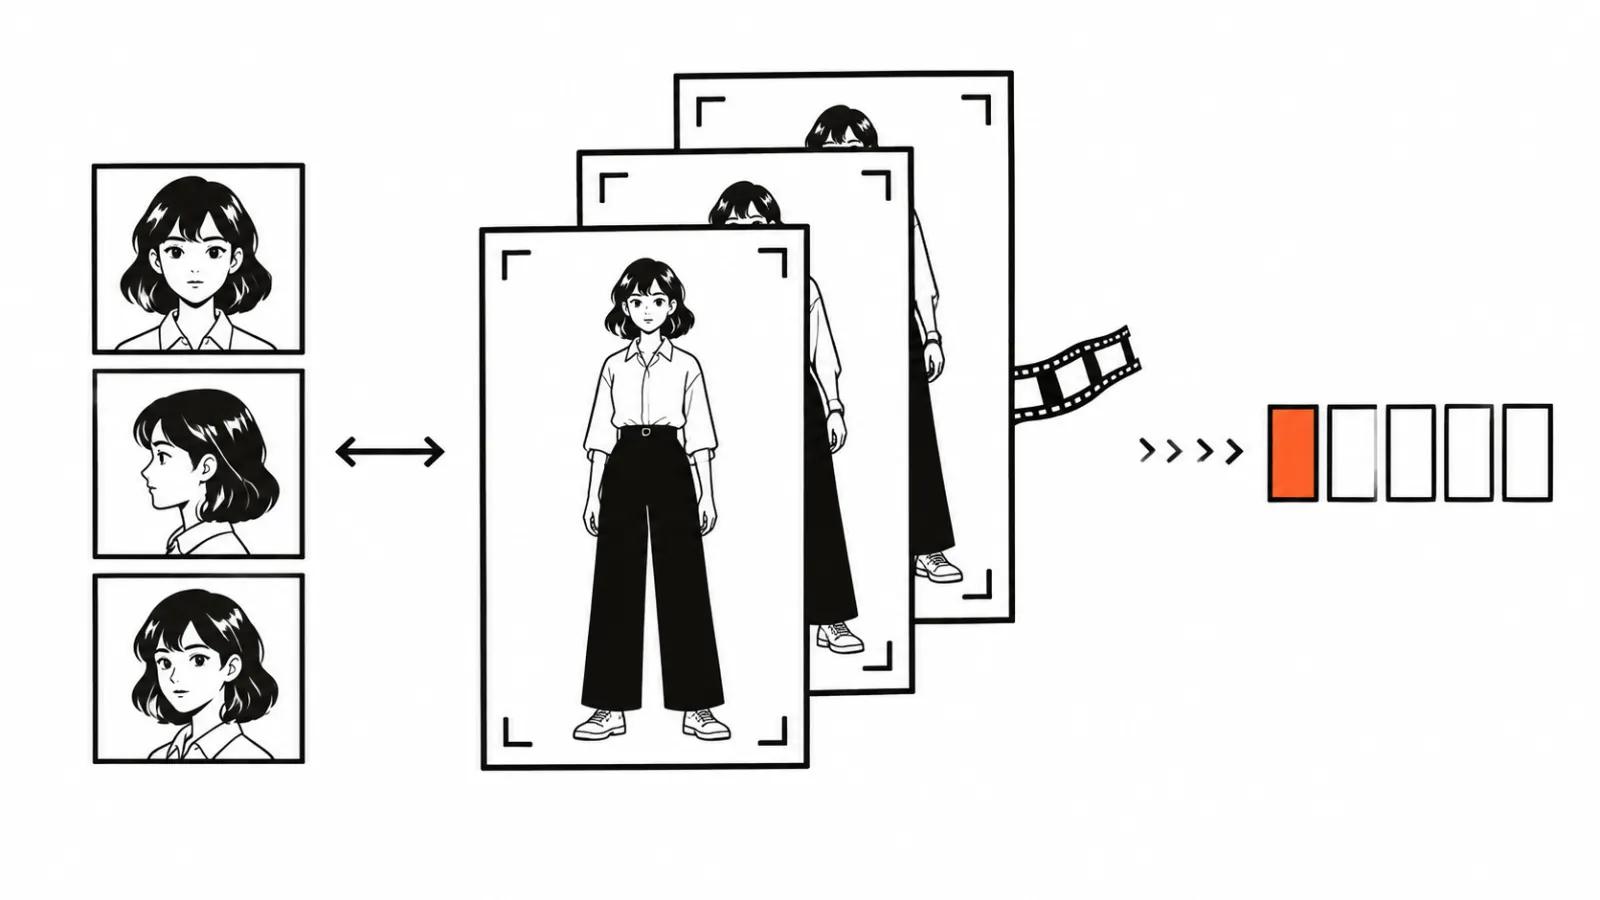
A file can be combined with reference images, video and audio. One exception: first-and-last-frame mode is closed when a file is in the request. Materials are addressed by number in the prompt, "Image 1", "Video 1", "Audio 1", so the model knows which one you mean.
The documented example: six months of revenue in 22 seconds
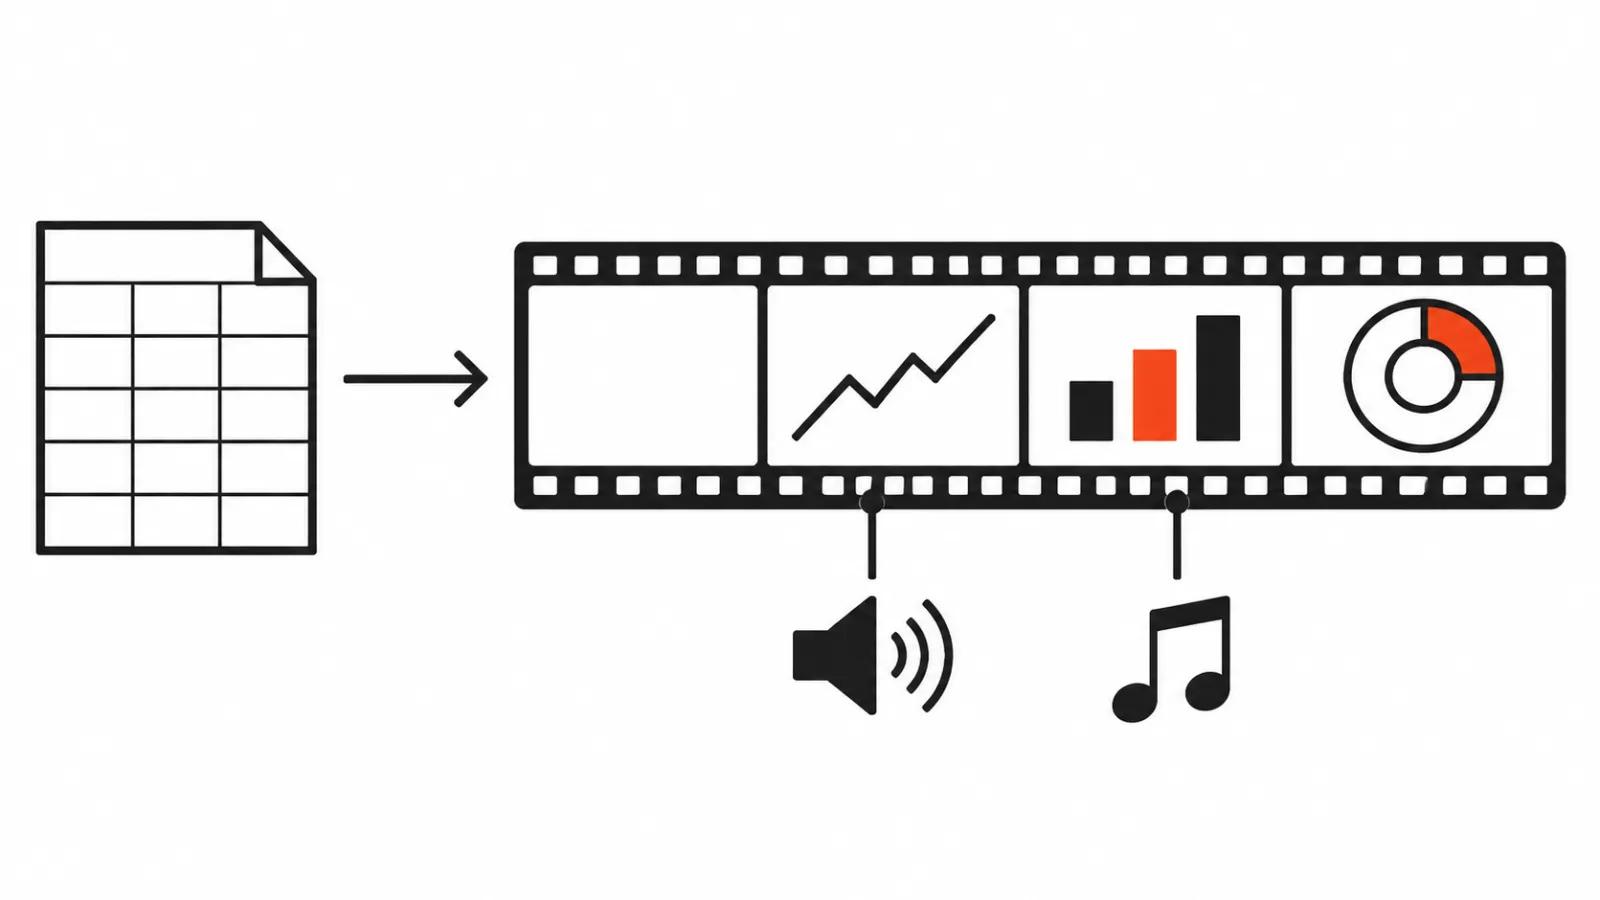
The first example is worth copying because it is reproducible. The input is an Excel sheet with monthly revenue for half a year. The output is a 22-second clip made of four segments: a title card, a line chart of three markets, bars showing growth, a donut chart with the total. A narrator reads the copy and the music sits underneath.
Values in the prompt are written out by cell, B7, G7, H8 and so on. The style is set on its own line: white background, soft colored blocks, minimalism. Those two decisions carry the whole result.
The second example is shorter. A pptx deck becomes an ad for smart glasses, and there the model writes and edits at once, since the slides already carry the order of shots.
Why I type the numbers in myself
My position: for a draft and a storyboard this is fast, for a report it is risky. The gap sits in one detail. A generative model draws a figure as part of the picture, with no guarantee of exact arithmetic. A bar can land in the right place while the label beside it turns out to be a plausible guess, and on a phone in a feed almost nobody catches that.
So the working rule is simple. Put the values into the prompt directly, the way the documentation does with cell references, and do not expect the spreadsheet inside the file to sort itself out. Recalculate shares and percentages beforehand and paste them as text. After generation, check every label against the source, frame by frame, because a wrong number is the first thing a viewer remembers.
The second layer people miss is units. Thousands, millions, percentages, currency, month names. The model can mix one up with another or add a zero that was never there.
Limits that shape the script
Duration runs from 2 to 30 seconds. Resolution is 480P, 720P or 1080P, 30 frames per second, and sound is on by default. The link to a result lives for 24 hours, so download on the same day.
Structure grows out of that ceiling. Thirty seconds holds three or four screens: a title, the main chart, a closing number. Anything longer gets cut into pieces and assembled in an editor, since a full quarterly report does not fit one request.
AI video infographics and motion design: who does what
For a report where a wrong figure is unacceptable, exact charts are safer built in motion design. There the value is bound to data, the curve is generated from numbers, the label comes straight from the sheet.
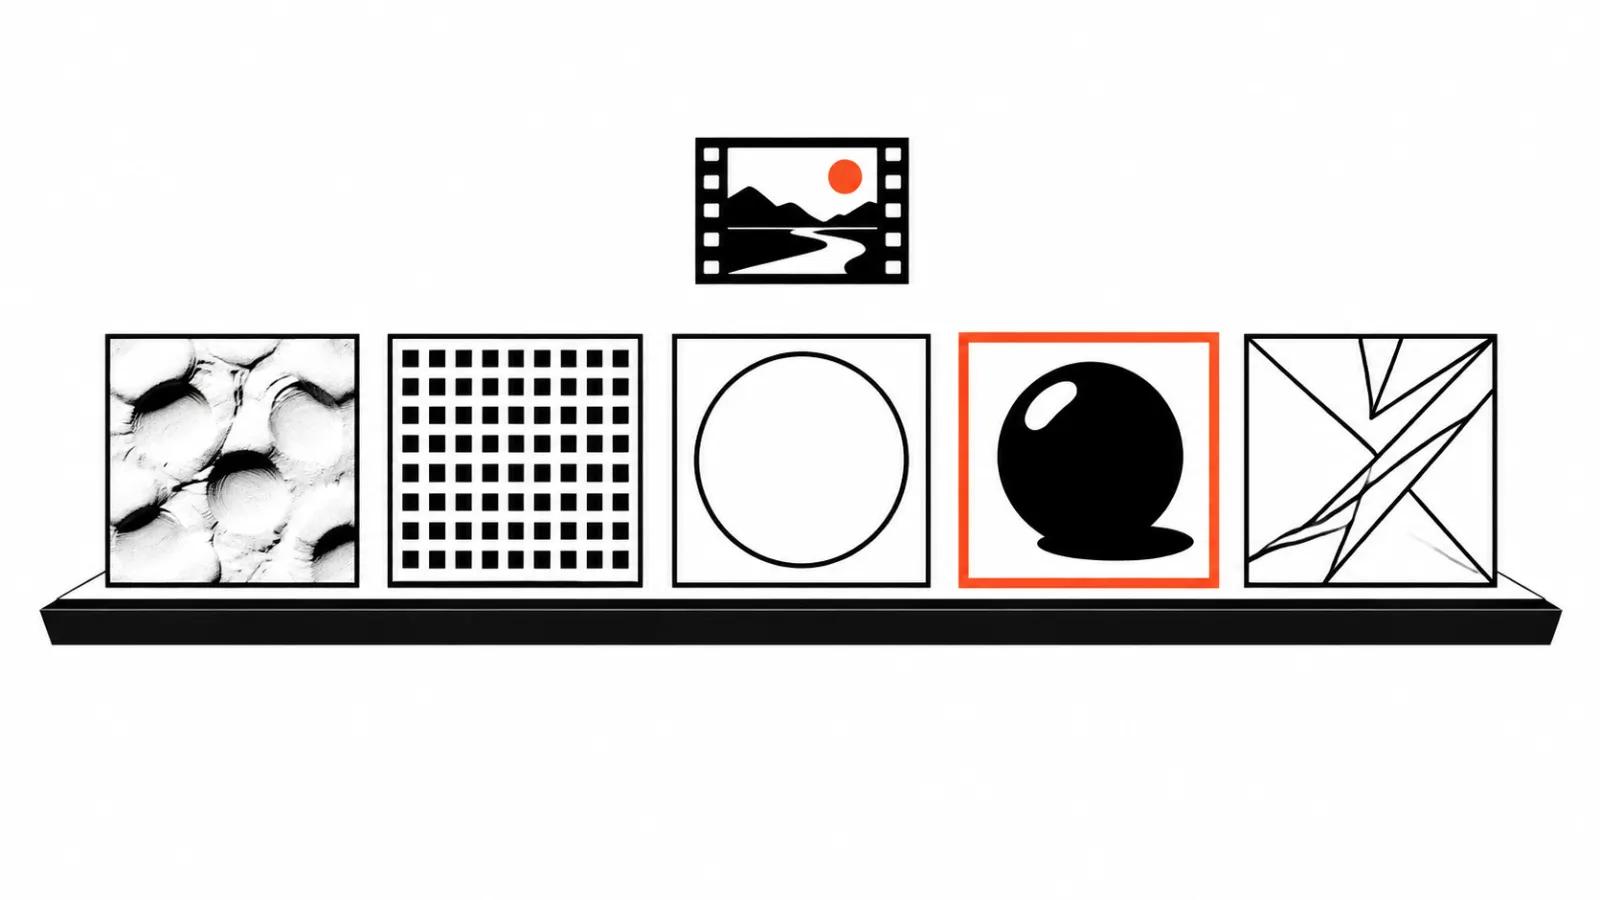
The model is stronger elsewhere. Background, transitions, characters, a live camera, atmosphere around the number. The hybrid setup looks like this: pull the precise chart out of motion design and let the model paint the environment and movement around it. If the genre is new to you, our piece on what motion design is covers the basics.
Where it pays off in ads and social feeds
Advertising follows another logic. Clarity within two seconds matters, and a precise decimal does not. A donut with market share or three bars of sales growth reads better than a table, especially in a vertical frame. High-volume output and vertical video ads need a template: one style, many versions, a predictable cost per clip.
Then comes the routine worth automating. Our AI video production runs on the same shape: short segments, selection, editing. For wording we keep a separate guide where AI video prompts are broken down part by part.
How I would build a clip from a spreadsheet
First, prepare the sheet for the clip. Three markets, six months, growth in percent, a total. Strip the extra rows and keep only what appears on screen.
Second, write the prompt segment by segment. Title, chart, bars, donut. In each one, values from the cells, axis labels, units and style.
Third, generate at 720P. A draft exists to test rhythm and composition, and full resolution is wasted on early passes.
Fourth, check the frames. Every figure, every percentage, every month. A pause and a second screen with the source help a lot.
Fifth, download the same day. After 24 hours the result link is gone.
Sixth, if the clip goes into a report or an investor deck, rebuild the charts in motion design from the verified numbers and keep the background and transitions from generation.